
Ask five research houses how big the street and roadway lighting market is, and you will get five different answers. For the same base year, published figures range from USD 9.65 billion to USD 11.71 billion — a spread of more than ten percent. Growth rates swing from 3.7% to over 6%. Someone new to the category could be forgiven for concluding that nobody actually knows.
Somebody does know; the problem is that each report measures a different thing. That distinction matters more this year than usual, because the market is not growing in one place. It is growing in three different layers at once, and the layer you watch determines the number you see. This article walks through those layers in the order the money moves (light source, controls, and power supply) and ends with what the trends mean for anyone stocking or specifying street lights, rather than just citing them.
What the Street and Roadway Lighting Market Numbers Actually Say
First, scope. “Street and roadway lighting” can mean lamps only, or lamps plus poles, control gear, installation, software, and maintenance services. Hardware made up 60.95% of the market in 2025 by one provider’s breakdown, with software and services covering the rest (Mordor Intelligence, 2026). A report that counts the full system will land higher than one that counts luminaires. Neither is wrong; they are just not the same measurement.
With that caveat on the table, here are the headline figures side by side.
| Source | Base year and size | Forecast | CAGR |
|---|---|---|---|
| SNS Insider | USD 9.65B (2025) | USD 13.88B (2035) | 3.70% |
| The Business Research Company | USD 11.71B (2026) | USD 14.93B (2030) | 6.3% |
| Mordor Intelligence | USD 10.63B (2026) | USD 13.75B (2031) | 5.28% |
| MarketsandMarkets | USD 10.0–12.0B (2025) | USD 22.0–26.0B (2036) | ~6–8% |
Source: Published report summaries, 2025–2026
The drivers all four lists share are familiar: LED efficiency, infrastructure spending, smart city programs, and energy regulations. The player list is familiar too (Signify, Acuity Brands, Eaton, Schréder and their peers), and it is not where the interesting movement is. The useful discipline is a three-point check before you repeat any single figure: what base year, what scope (lamps or full system), and where the forecast ends. A 6% CAGR to 2030 and a 3.7% CAGR to 2035 can describe the same market through different end points.
What the disagreement actually reveals is structural. The market is changing in three layers that move on different clocks. Read them separately and the numbers stop fighting each other.
One market, three clocks
Light source
Settled: LED took 83.55% of new installs.
Controls
Compounding: smart growth reads 6.82–20.9%.
Power supply
Rewritten: off-grid builds where grids never reached.
The Light Source Layer: LED Has Won, and the Retrofit Tail Is Long
On the light source axis, the argument is over. LEDs accounted for 83.55% of the street and roadway lighting market in 2025 (Mordor Intelligence, 2026). Any luminaire you stock or spec today is effectively an LED luminaire, and no supplier conversation needs to reopen that question.
Yet on a different axis, the split between conventional and connected systems, conventional lighting still held 56.15% of the market in the same year, from the same source. Both numbers describe reality. One says the lamp has been replaced almost everywhere new installs happen. The other says the system around the lamp has not. That gap between a settled lamp and an unsettled system is where the next two layers of this article live.
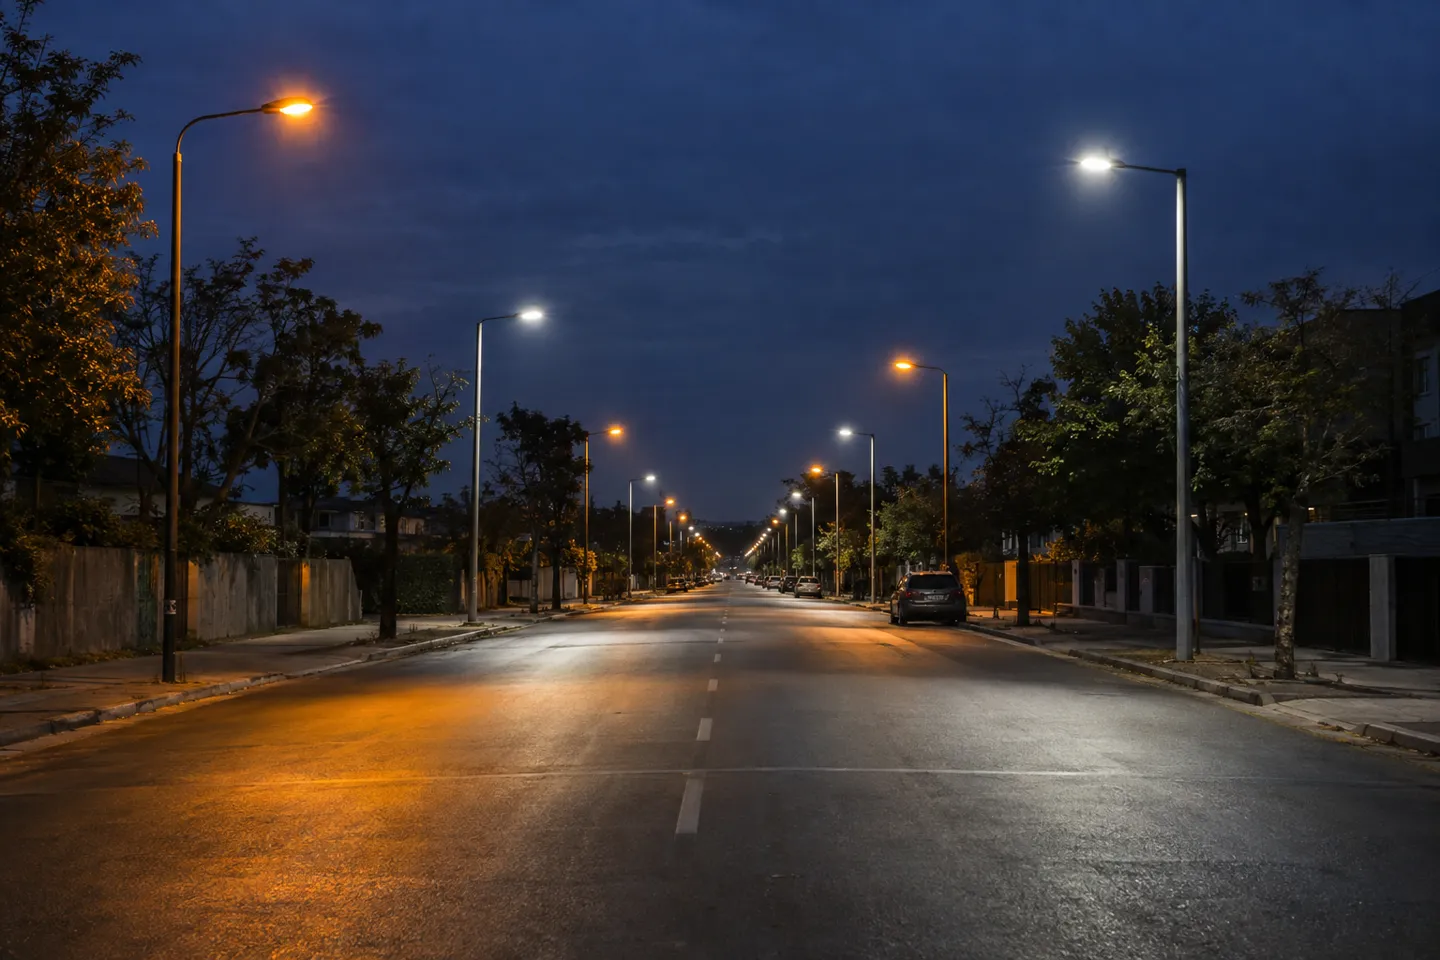
The retrofit tail is long because the installed base is enormous and the economics are patient. Public authorities that own their lights replace them when budgets allow, and the savings case keeps improving: streetlights run 50 to 65 percent more efficient than the alternatives they replace, per the New York Power Authority’s statewide program (NYPA, 2023). Ownership structures slow the tail further. In one US city’s budget debate earlier this year, residents questioned why the town pays about USD 5.5 million a year renting its streetlights from the utility when buying and retrofitting them could be paid for by roughly USD 2.8 million in annual energy savings (r/lexington, 2026). Where the utility still owns the assets, the “obvious” LED upgrade waits on a lease negotiation.
THE NUMBER PAIR THAT EXPLAINS THE DISAGREEMENT
83.55%
of the light-source mix is already LED (new installs, 2025)
vs
56.15%
of the market is still conventional, unconnected systems
The lamp was replaced. The system wasn’t.
The practical takeaway for judging any market claim: to place a city or a country on this curve, look at the share of old lamps still burning in its installed base, not at the LED share of new purchases. New-install share tells you where suppliers have already won; installed-base share tells you how much spending is still queued.
The Controls Layer: Where Growth Compounds
Smart street lighting has been “five years away” for a decade, which makes people dismiss it. The numbers say otherwise. You just have to read the two headline figures for what they measure.
| Metric | What it measures | Reading |
|---|---|---|
| Smart/connected segment CAGR 6.82% (Mordor, to 2031) | growth within the market’s own segmentation | steady segment-level expansion |
| Individually controlled units, 32.9M installed (end-2024), 20.9% CAGR (Berg Insight) | growth of the global installed base | rapid compounding from a low base |
Source: Mordor Intelligence 2026; Berg Insight
The segment figure is conservative because it slices the market the way reports always have. The installed-base figure is dramatic because it starts from a small denominator: 32.9 million controlled lights is a fraction of the world’s streetlights. Both point the same direction. Adoption is early, and the growth is in the backlog, not the announcement press releases. That tracks with the layer-two finding: with 56.15% of systems still conventional, the addressable base for controls is most of the market.
Value is migrating with it. Hardware still carries 60.95% of market revenue, but software and services are forecast to grow at 6.95% through 2031, faster than the hardware they attach to (Mordor Intelligence, 2026). Wireless connectivity platforms (6.49% CAGR) are pulling share from wired installs, and niche applications like tunnels and underpasses are compounding at 6.38%. None of these will upend the market this year. All of them change what buyers write into tenders.
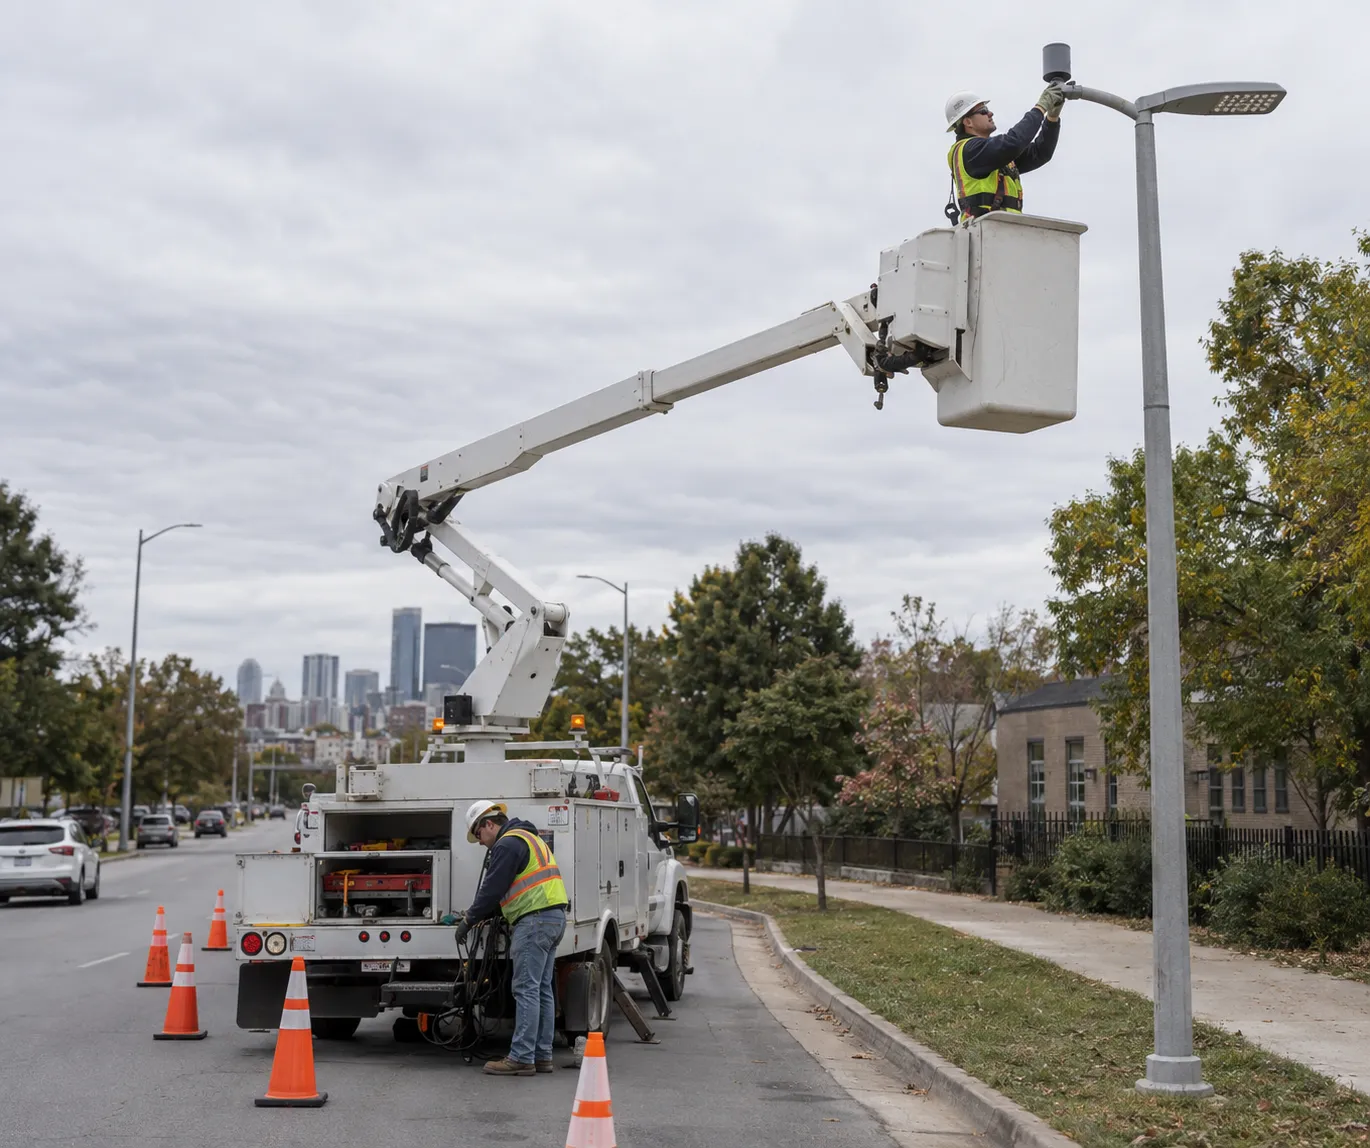
That last point is the one with teeth. Municipal specifications increasingly expect a photocell receptacle (NEMA or Zhaga seven-pin) even when the city has no central management system yet, for the same reason buildings were pre-wired for data decades ago: retrofitting sockets into an installed fleet costs more than specifying them at the factory. For a stockist, that turns “smart-ready” from a marketing feature into a bid-compliance line item.
The boundary: controls value collapses where the grid itself is unreliable. A dimming schedule is worthless on a road that darkens at random, and the first problem in those markets is whether the light works at all. That is where the next layer takes over.
The Power Layer: Where New Demand Lives
Where the demand map splits
Asia-Pacific held 36.85% of the market in 2025 and is forecast to grow fastest among regions at 6.12% (Mordor Intelligence, 2026). But regional share tables fold two very different markets into one column.
One region column, two demand maps
Grid-reliable markets
Demand: a retrofit budget competing for attention against other infrastructure.
Who buys: public authorities that own their lights, or rent them from the utility.
What moves them: the 50–65% efficiency savings case, and lease-versus-own math.
Off-grid emerging markets
Demand: a first build — roads that have never had a light, where the grid is absent, intermittent, or simply not planned to reach.
Who buys: municipalities, development banks, and donor programs.
What moves them: documented battery configuration, autonomy, and serviceable warranty.
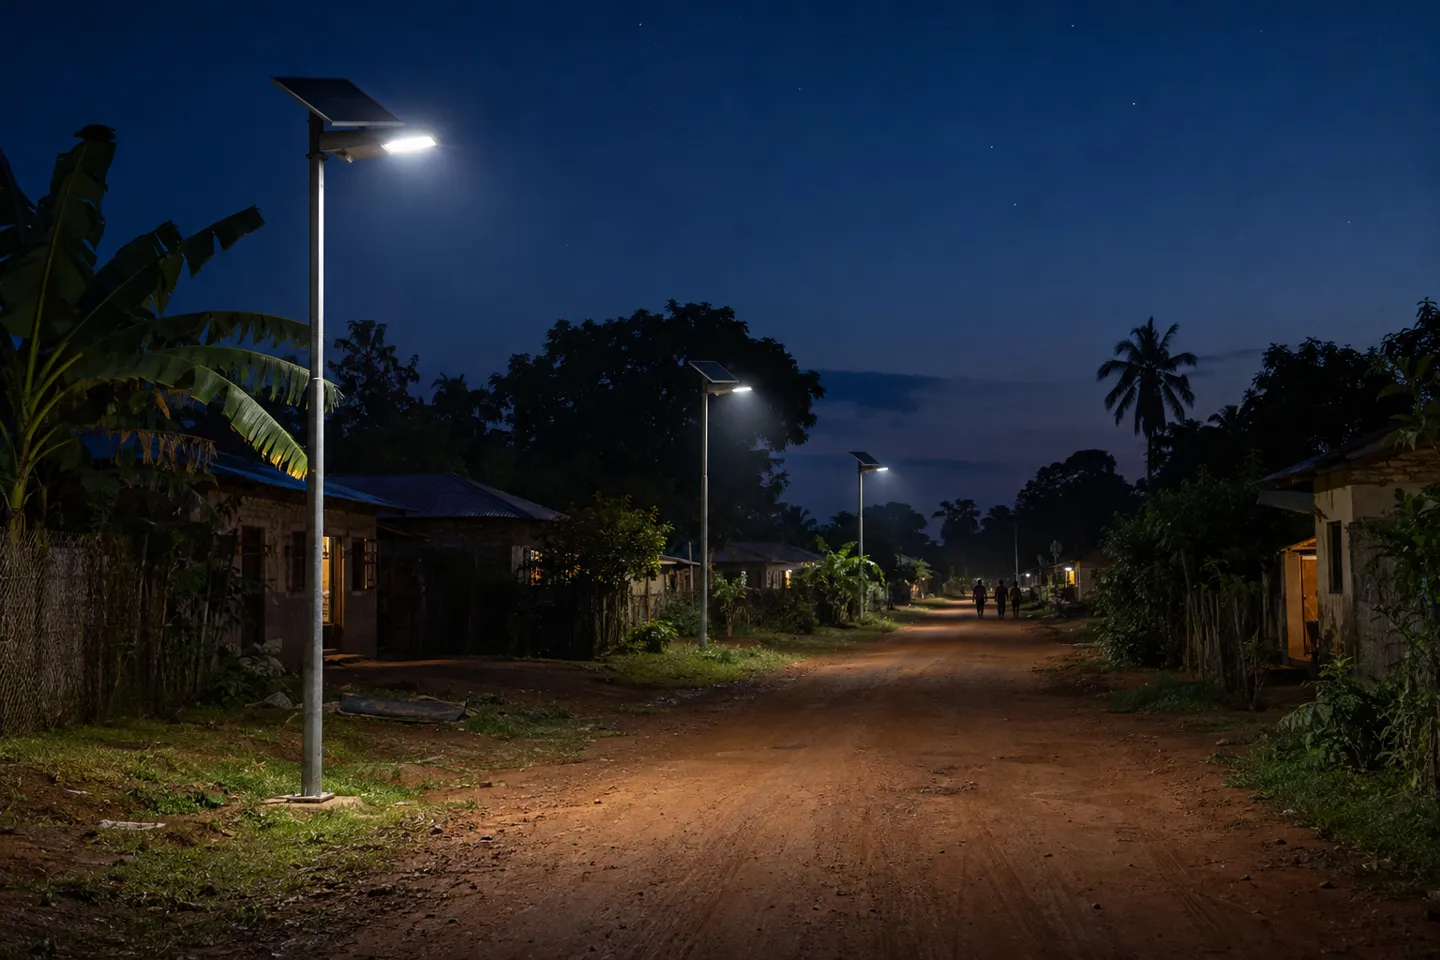
That second market barely registers in the headline segmentation, and its scale is easy to underestimate. The World Bank’s Lighting Global program projects off-grid solar as the least-cost way to provide electricity access to nearly 400 million people by 2030 (ESMAP/Lighting Global, 2024). Sales data confirms momentum rather than projection: affiliates of the industry association GOGLA sold more than 10 million off-grid solar energy kits in 2025, the highest annual total on record (GOGLA, 2026). Public lighting follows household electrification into these regions with a lag, funded by municipalities, development banks, and donor programs.
The off-grid failure ecosystem
Here is the part the market reports never print: in off-grid street lighting, the light source is not what fails. LED packages rated for 25,000 to 50,000 hours routinely outlive the systems around them. The recurring failure point is energy storage: batteries sized too small, or fitted with cells that cannot survive the local duty cycle. Buy-side guides for African projects now open with the same answer to their first question: specify LiFePO4 chemistry, an adequately sized panel, and three to five days of autonomy (Etenda, 2026). When a buyer’s first question is “what configuration survives,” you can infer what the last shipment looked like.
The economics amplify the damage. A failed lamp in a grid market is a maintenance ticket. A failed solar street light on a donor-funded rural road is a headline, a stalled second phase, and a distributor’s reputation in a market where word travels faster than replacement parts. That is why warranty terms and battery configuration disclosure deserve more scrutiny in the solar line than unit price.
Before comparing solar street light quotes: confirm local sun hours and rainy-season length, then battery chemistry (LiFePO4 preferred), stated autonomy in days, and panel wattage. Price per unit is the last column that matters. A light that dies in its second rainy season was never cheap.
How power supply decides procurement mode
Grid reliability doesn’t just determine the technology; it determines who buys and how. Where the grid is dependable and utilities own the assets, procurement revolves around ownership economics: the rent-versus-buy calculation from layer two, with LED conversion savings of 50 to 65 percent funding the switch. Where lighting is built off-grid, procurement is project-based: tenders specify autonomy days and battery chemistry instead of wattage, and the winning suppliers are the ones who can document both.
One segment figure spans both worlds: the 50–150 W power band carried 53.15% of the market in 2025 and is forecast to grow fastest of all bands at 7.05% (Mordor Intelligence, 2026). That band covers the arterial and residential roads that both grid markets retrofit and emerging markets build first. It is the closest thing this market has to a universal stocking decision, and it is where the next section starts.
Before you shortlist solar or 50–150 W suppliers, get WOSEN’s per-model configuration, efficacy, and warranty documentation.
Request configuration detailsFrom Market Trend to Purchase Order
Adjust the stock mix before the SKU list
Translating the three layers into inventory produces a structure, not a list. The 50–150 W band is the base. It is where demand concentrates and where forecast growth is fastest, so depth of range and availability there matters more than breadth elsewhere. Smart-readiness is the second line: units with NEMA/Zhaga receptacle options, held even for customers who are not buying controls yet, because the bid-compliance clock is already running. The third line is off-grid solar, stocked (or at least sourced) separately, with its own warranty terms, because its failure modes and diligence requirements have nothing in common with grid products.
Verify the supplier before the price
Every one of those lines is a claim until a supplier documents it. Five checks separate a real partner from a catalogue:
- Efficacy, tested at fixture level. Ask for the tested lm/W figure and the test conditions, not the LED-datasheet number. Volume-production street lights now reach around 220 lm/W at the top of the range, so a supplier quoting 130 lm/W as premium needs a reason.
- Warranty, in writing, per product line. Whole-lamp terms differ by line. A supplier who warranties solar and grid products identically probably has not thought hard about either.
- Off-grid configuration disclosure. Battery chemistry, autonomy days, and panel wattage, per model, with the option to configure per project. Refusal here is a fail.
- Certification coverage for your customs regime. CE and RoHS for Europe, UL or ETL for North America, SAA for Oceania, and the export documents your market actually clears on.
- Lead time and order visibility. Thirty-five to forty days is a workable production window at this tier; what matters is whether the supplier can show you order status inside it, not just promise it.
What tenders will ask next
The specification frontier is moving the same direction everywhere: IP65 sealing as the floor (IP66 where dust or coastal salt is severe), an efficacy floor written into the luminaires section, control-interface provisions, and warranty years as a scored line. Procurement mode adds its own pressure. The rent-versus-own math is pushing more cities toward owned assets, while supply-side lead times have become their own risk category; municipal contractors report electrical equipment procurement turning “brutal” through 2026 (r/civilengineering, 2026). In that environment, a supplier who documents lead time is worth more than one who is two percent cheaper.
| Growth line | Fits you if | It fails if | Verify before ordering |
|---|---|---|---|
| 50–150W grid-tied mains | you serve municipal or contractor buyers in grid markets | you only sell via retail shelf | tested fixture lm/W, IP rating, driver brand |
| Smart-ready (NEMA/Zhaga) units | your market’s tenders are starting to require interfaces | your buyers have no controls roadmap for a decade | receptacle option availability, dimming protocol support |
| Off-grid solar line | you cover regions with unreliable grids or donor-funded road programs | you cannot support warranty claims locally | battery chemistry, autonomy days, panel wattage, warranty terms |
Source: Market data per cited reports; checklist per supplier-verification practice
What This Market Means for Your Line Card
Run the three layers back through a stocking decision and they compress into one sentence each. The lamp layer is settled: LED’s 83.55% share means no one wins anything by stocking technology transitions. The controls layer is early and compounding: with 56.15% of systems still conventional and smart segments growing from both ends of the estimate range (6.82% to 20.9%), interface-ready stock is a call option on the next tender cycle. The power layer is where the volume growth lives: the 50–150 W band (53.15% share, 7.05% CAGR) and the off-grid build-out, at ten million kits a year and climbing, are the demand that did not exist a decade ago.
The uncomfortable implication is that a line card built on one cheap LED SKU misses all three. Commodity lamps at a commodity price are exactly the layer where differentiation has ended; the defensible margin sits in the concentration (the right power band), the compliance (the interfaces), and the credibility (the off-grid warranty you can honor). Those three cannot be improvised by a buying desk; they have to be engineered in by a supplier.
Which changes what “supplier” means for this category. The checks in the last section (tested efficacy, per-line warranty terms, configuration disclosure, certification coverage, lead-time visibility) cost a supplier real capability, and that is what makes them useful as selection criteria rather than box-ticking.
Our own range at WOSEN is built around that same structure, and we hold it to the standards above: a grid-tied street light line engineered to documented efficacy targets, solar series listed at 5-year whole-lamp warranties, production tracked in ERP across a 35–40 day lead time with a 12-hour response commitment on overseas inquiries, and after-sales commitments that run batch-failure investigations down to grid-voltage research, because an off-grid claim you cannot service is a liability, not a sale. Whichever supplier you choose, get those five in writing.
The line-card formula this market supports
50–150W
mains as the base: 53.15% share, 7.05% CAGR.
Smart-ready
interface options as the option value: 6.82–20.9% smart growth, 56.15% still to convert.
Solar line
off-grid with verifiable warranty as the regional growth line: 10M+ kits/yr market-wide.
If the next tender cycle is close enough to plan for, it costs nothing to put a supplier who builds to this checklist (WOSEN among them) on your quote list and compare.
Get the five supplier checks answered in writing
WOSEN builds grid-tied and solar street light lines to the standards above: documented efficacy, per-line warranties, configuration disclosure, and 35–40 day ERP-tracked production with a 12-hour response on overseas inquiries.
Put WOSEN on your quote listReferences
- Mordor Intelligence. “Street And Roadway Lighting Market Size & Share Analysis.” 2026.
- SNS Insider. “Street Lighting Market Size, Share, Growth & Trends, 2035.” 2026.
- The Business Research Company. “Street And Roadway Lighting Market Report 2026.” 2026.
- MarketsandMarkets. “Street Lighting Market Size, Growth, Trend and Forecast to 2036.” 2026.
- Berg Insight. “The Global Smart Street Lighting Market.” 2025.
- New York Power Authority. “Statewide LED Streetlight Program.” 2023.
- r/lexington. “Why are we paying $5.5M a year to rent streetlights we could own?” 2026.
- r/civilengineering. “Is anyone else getting crushed by electrical equipment lead times?” 2026.
- GOGLA. “The 2025 Global Off-Grid Solar Market Report.” 2026.
- ESMAP / Lighting Global. “Off-Grid Solar Market Trends Report companion site.” 2024.
- Etenda. “Best Solar Street Lights for Africa Projects: A Practical Guide for Buyers.” 2026.
- WOSEN. “Series LUMINA Adjustable LED Street Lights.”
- WOSEN. “After-Sale Services.”
- WOSEN. “LED Street Lights.”
- WOSEN. Homepage.

 English
  Spanish
  French
  German
  Italian
  Arabic
  Russian
  Portuguese
  Dutch
Dutch  Indonesian
  Turkish
  Polish