In commercial and industrial lighting, evaluating fixtures solely by total lumens and wattage is a dangerous amateur’s gamble. If the fundamental light distribution is incorrect, even the highest lumen output will violently transform into blinding glare or be wasted entirely on useless dark zones, potentially leading to failed municipal site inspections or severe contract breaches. To truly master outdoor and indoor illumination, you only need to conquer three core engineering areas: understanding the physical boundaries of light mapping, decoding the photometric polar curves used by top-tier manufacturers, and mastering the 5 IES light distribution types to match the perfect optical footprint to your site topology.
Demystifying Light Distribution: Physics and Core Concepts
Why must we first clarify these seemingly dry, abstract physical boundaries? Because confusing technical optical terms like “beam angle” and “field angle” is the number one reason high-bay warehouse aisles and expansive factory floors suffer from the dreaded “Zebra Effect”—a highly dangerous and visually exhausting alternating pattern of intense bright spots and deep dark shadows. Grasping the physics in this section is your absolute first line of defense against wasting precious photometric energy on ceilings or creating hazardous, non-compliant work environments.
Direct vs. Indirect Lighting: Mapping to the Polar Grid
The fundamental foundation of all spatial lighting design begins with understanding exactly how photons are physically directed toward the intended target area. We can broadly categorize this physical behavior into direct and indirect lighting, both of which map very differently onto a professional photometric chart.
- Direct Lighting (The 0° to 90° Zone): Imagine a highly focused flashlight pointed straight down at a workbench. Direct lighting pushes virtually 100% of its light output downward toward the working plane. On a standard polar grid, the maximum candela peak (the strongest point of light penetration) will always be concentrated tightly in the lower hemisphere. This mechanical method provides maximum illumination efficiency and raw punch for intricate tasks, but it requires incredibly careful glare management through sophisticated lenses.
- Indirect Lighting (The 90° to 180° Zone): Picture pointing that exact same flashlight upward at a matte white ceiling to illuminate the entire room via diffuse reflection. Indirect lighting deliberately directs the majority of its output upward into what we call the “Uplight” zone. While this architectural approach creates a beautifully soft, virtually glare-free environment with minimal harsh shadows, engineers must be acutely aware of the Light Output Ratio (LOR). Indirect lighting suffers from massive LOR absorption losses; the ceiling paint, ceiling texture, and ambient dust will swallow a significant percentage of your expensive lumens before they ever bounce back to reach the floor.
Beam Angle vs. Field Angle: Clarifying the Boundary
When purchasing a commercial high-bay light, an arena floodlight, or a street luminaire, the specification sheet will often boast a specific “angle.” Assuming this single angle represents the absolute hard edge of the light is a phenomenally costly engineering mistake. You must distinguish between the beam and the field to prevent dark zones.
- Beam Angle (The Core Intensity): By strict photometric definition, the beam angle is the precise angle between the two planes of light where the intensity drops to exactly 50% of the maximum center candela. This is the “punchy,” highly visible part of the light that does the heavy lifting for visibility.
- Field Angle (The True Boundary): The field angle measures the much wider, outer peripheral boundary where the light intensity finally drops to 10% of the maximum center candela. This is the absolute edge of usable illumination.
The real-world danger lies in the gap between these two metrics. The spatial zone between the 50% beam angle and the 10% field angle is known as the “spill light” or transition zone. If a lighting designer spaces the poles assuming the beam angle is the hard edge of the light, the overlapping transition zones will fail to provide adequate overlapping illumination. This leaves noticeable, dangerous dark gaps between fixtures. Precision optical planning always accounts for the field angle drop-off to ensure seamless uniformity.

How to Read a Photometric Polar Curve Like an Expert
When you receive a technical specification sheet from an overseas supplier, the Polar Curve (also known as a Photometric Web) is your ultimate, undeniable lie detector. Learning to read this graph grants you X-ray vision, allowing you to accurately predict severe glare risks and visually verify if the light will actually hit your target surface long before a single fixture is purchased or installed. It permanently solves the dreaded “buyer’s expectation versus reality” blind box.
Engineering Note: Highly accurate polar curves are generated through rigorous, unbiased goniophotometer testing, governed by authoritative protocols such as the IES LM-79 standard for electrical and photometric measurements.
Symmetrical vs. Asymmetrical Light Patterns
Before diving into the complex numerical coordinates, you must first learn to recognize the qualitative shape of the curve. The polar graph visually maps how raw light is squeezed, stretched, or manipulated by the optical lens.
- Symmetrical Distribution: Imagine a massive bonfire burning in the dead center of an empty town square. The light radiates equally in all 360 horizontal degrees. On a photometric polar chart, the curve will look like a perfectly mirrored apple or a smooth, round water drop. The solid line (representing the C0-C180 physical plane) and the dashed line (representing the perpendicular C90-C270 plane) will overlap flawlessly. This uniform shape is ideal for illuminating the dead center of a large, open area where light needs to go everywhere equally.
- Asymmetrical Distribution: Now imagine a modern LED street light installed on the extreme edge of a highway. If its light were symmetrical, exactly 50% of the expensive illumination would be wasted on the grass and trees behind the pole. Therefore, optical engineers use specialized TIR (Total Internal Reflection) lenses to aggressively “bend” the light forward. On the polar chart, the curve will bulge aggressively to one side (the street side) while hugging tightly to the center axis on the opposite side (the house side).
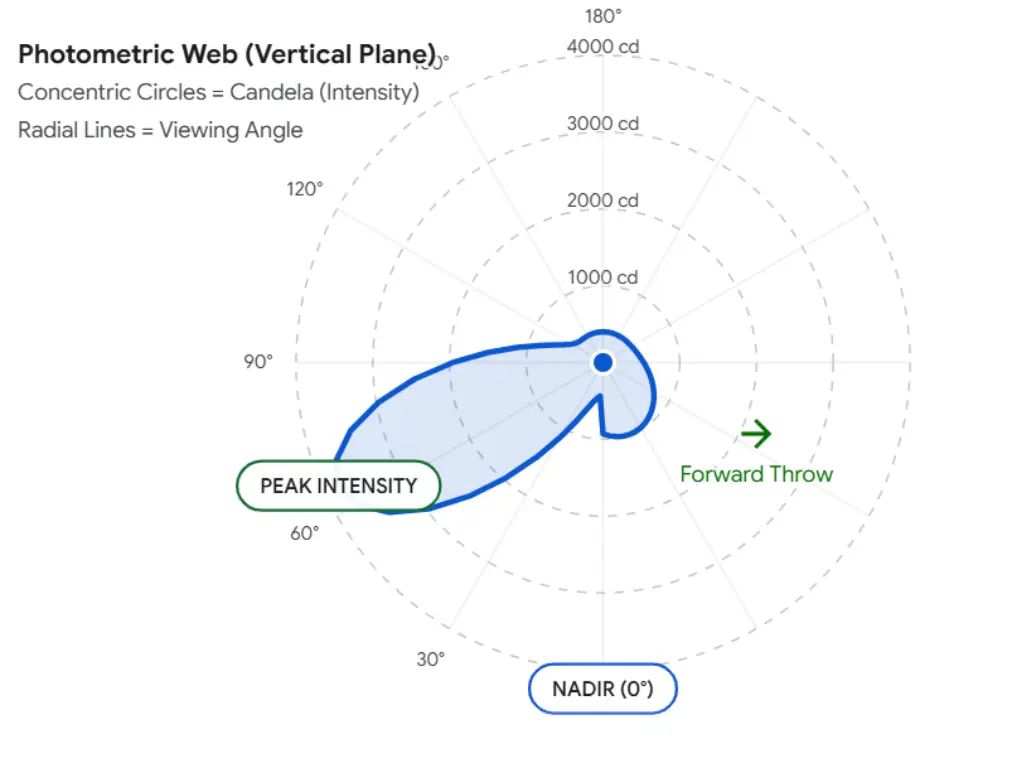
Decoding the Coordinates: Nadir, Candela, and Light Intensity
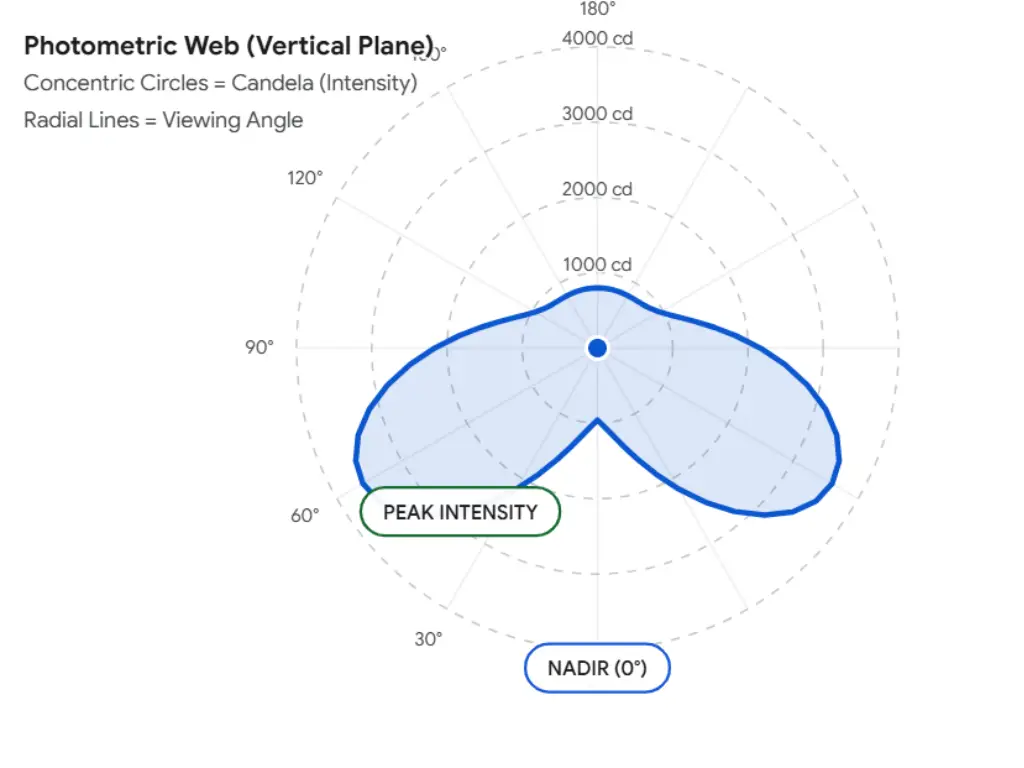
Once you understand the basic shape, you can extract the exact quantitative optical data by reading the circular grid, much like a pilot reading a radar screen.
- Nadir (0° Axis): The absolute center bottom of the graph is exactly 0 degrees, known technically as the Nadir. Imagine standing directly underneath the light fixture and looking straight up into the lens; you are standing at the Nadir.
- Radial Lines (Viewing Angles): The straight lines radiating outward from the center (like spokes on a bicycle wheel, marked clearly at 30°, 60°, 90°) represent the specific angle at which the light is traveling away from the fixture.
- Concentric Circles (Candela): The rings expanding outward from the center represent raw light intensity, measured in Candela (cd). The further a colored curve reaches toward the outer rings, the stronger the “punch” of light in that specific direction. Note that Candela measures directional intensity, not total lumen volume.
Putting it together: If you trace the bulging shape of an asymmetrical curve and see its furthest peak hits the 5,000 Candela ring exactly at the 60° radial line, you immediately know the truth: “This fixture throws its most powerful beam of light out at a 60-degree forward tilt, making it perfect for pushing light across a wide multi-lane road without blinding nearby pedestrians.”
The 5 IESNA Light Distribution Types Explained
The 5 main light distribution types established by the Illuminating Engineering Society (IES) are not just theoretical academic classifications; they are the universal commercial language of the lighting industry. Precision matching of these IES types to your site topology is the only guaranteed shortcut to maximizing pole spacing, reducing the total quantity of fixtures required, and drastically slashing your overall project budget.
Linear Pathways: Type I and Type II
These specialized distributions are engineered to push light in narrow, highly controlled linear paths rather than wide circles, minimizing lateral waste.
- Type I: A two-way, extremely narrow, and symmetrical lateral distribution. It is engineered specifically for walkways, narrow bicycle paths, and long, skinny warehouse aisles. The fixture is typically assumed to be mounted dead center over the pathway. Its preferred illuminating width is approximately 1.0 to 1.5 times the mounting height.
- Type II: Slightly wider and more robust than Type I, this pattern is designed for narrow, single-lane local roadways, jogging paths, and wide pedestrian walkways. Unlike Type I, Type II fixtures are usually mounted on the edge of the road, throwing a controlled, elongated oval of light slightly forward and significantly sideways. The maximum light width generally covers 1.0 to 1.75 times the mounting height.
Asymmetric Roadways & Forward Throw: Type III and Type IV
These two types represent the vast majority of commercial outdoor, municipal, and street lighting applications, adhering strictly to highly distinct use cases.
- Type III: The undisputed gold standard for general roadway lighting and large parking lot interiors. It provides a wide, forward-projecting footprint that pushes light deep into the street while spreading it exceptionally wide to reach the next pole. The optimal coverage area is 1.75 to 2.75 times the mounting height. It strikes the perfect balance between forward throw distance and lateral uniform spread.
- Type IV (Forward Throw): This is a highly specialized, extremely asymmetrical distribution. It produces a distinct semi-circular (or “D” shaped) optical footprint. Type IV is engineered specifically for perimeter boundary lighting, building-mounted wall packs, or the absolute edges of a commercial property. It forcefully pushes the maximum amount of light forward into the target area while drastically cutting off almost all light behind the pole. Its forward throw typically exceeds 2.75 times the mounting height.
Omnidirectional Area Lighting: Type V & VS
When you have a massive, open expanse and the mounting pole is located dead in the center, you require massive omnidirectional coverage.
- Type V (Circular): Provides a highly uniform, 360-degree circular light pattern. It is perfect for the center of massive commercial parking lots, large highway intersections, and high-mast airport applications.
- Type VS (Square): A highly efficient variation of Type V that pushes light into a 360-degree square pattern. This is incredibly useful for gridded parking lots or square plazas, as the straight square edges interlock much better than overlapping circles, minimizing dark gaps without requiring excessive fixture overlap.
| Application Scene | Recommended IES Type | Why It Works (Core Advantage) |
|---|---|---|
| Narrow Walkways & Bike Paths | Type I | Zero lateral waste; keeps light strictly contained on the linear path. |
| Single-Lane Local Streets | Type II | Slight forward push from the curb without crossing the opposite street boundary. |
| Multi-Lane Highways & Parking Interiors | Type III | Maximum lateral spread; allows for the widest pole spacing to save infrastructure costs. |
| Building Perimeters & Fencelines | Type IV (Forward Throw) | Pushes all light forcefully forward; absolutely prevents backward light trespass. |
| Large Open Plazas & High Mast | Type V / VS | Perfect 360° uniform coverage for central mounting locations. |
Hell-Mode Scenario: The “Zero Backlight” Challenge at the Property Line
Let’s strip away the clean academic theory and enter the most brutal B2B commercial scenario imaginable: illuminating a massive retail parking lot that shares a strict property line with an upscale residential neighborhood. You are tasked with providing intense, high-lumen security lighting for the commercial parking lot, but if even a fraction of a footcandle spills over the property line into a resident’s bedroom window, you will immediately face municipal fines, light trespass lawsuits, and forced equipment replacement. Simply relying on a standard Type IV lens is not enough. To achieve true physical cutoff at a distance of fewer than 10 meters, you must combine a Type IV distribution with a physical House-Side Shield (HSS), or deploy a specialized TIR lens meticulously calibrated in a dark room to achieve an absolute B=0 (Backlight = 0) rating.
Achieving this level of strict optical cutoff at the property line requires uncompromising manufacturing execution. Partnering with a full-chain manufacturer like WOSEN LED fundamentally mitigates your project risks. Utilizing private mold development, WOSEN equips fixtures with custom UV-resistant lenses maintaining over 92% light transmittance without yellowing. Every batch undergoes rigorous photometric testing in our in-house CNAS-standard dark rooms, ensuring zero deviation in the beam angle before shipping. Furthermore, we protect these sensitive optical components with superior thermal management using high-purity ADC12 aluminum die-casting and premium Philips/Meanwell drivers, confidently backing projects with an unmatched 5-7 year warranty that outperforms 90% of competitors.
Glare Control and Energy Efficiency: Compliance to ROI
Ultimately, possessing optical precision is not merely an engineering flex; it is the master key to controlling your financial statements. We must elevate the technical discussion of polar curves into the executive language of legal environmental compliance and Return on Investment. Every photon that does not hit your target area is a photon that is actively burning through your operational budget.
Navigating the BUG Rating System for Dark Sky Compliance
The BUG rating is the modern, rigorous standard for evaluating outdoor light pollution. If your project must comply with strict municipal or International Dark-Sky Association (IDA) regulations, understanding this acronym is completely mandatory.
- B (Backlight): The light directed behind the fixture. Controlling this prevents the costly property-line lawsuits discussed in our Hell-Mode scenario.
- U (Uplight): The light directed above the horizontal plane (90° and higher). This causes artificial sky glow, destroying astronomical visibility. More importantly for commercial businesses, every single photon of Uplight is pure wasted electricity.
- G (Glare): High-angle forward light (typically between 60° and 90°) that enters the human eye directly from the LED source, causing visual discomfort or dangerous temporary blinding for drivers.
A top-tier, Dark-Sky compliant full-cutoff fixture will typically boast a strict rating of U=0 and G≤1, ensuring all energy is forced downward, prioritizing safety and massive energy efficiency.
Total Cost of Ownership (TCO): A Comparative Calculation
Let’s walk through a forensic accounting of how bad optical distribution silently bleeds your project budget dry over a 5-year lifecycle. We will maintain a strict physical control variable: both scenarios must achieve a municipal requirement of exactly 15 Lux (approx. 1.5 fc) of average ground illuminance across a large facility using 100 pole fixtures.
- The Baseline Arena: We are illuminating a commercial roadway that operates 12 hours a night, 365 days a year, with an industrial electricity rate of $0.15 per kWh.
- The Wattage Trap: Scenario A uses a cheap, generic 200W street light with a basic Type V distribution. Because it lacks precision optical control, much of the light splashes uselessly into the surrounding grass and sky. Scenario B utilizes a precision-engineered Type III lens. By shaping the beam perfectly to the road geometry with absolutely zero lateral waste, it easily achieves the exact same 15 Lux on the ground using a highly efficient 120W fixture.
- The Daily Bleed: The difference is a staggering 80 watts per pole. For 100 fixtures running 12 hours, that equals 96 kWh of wasted energy every single night. At $0.15/kWh, the generic lights are bleeding $14.40 a day into thin air.
- The 5-Year Reality Check: Over a standard 5-year warranty period, that daily bleed compounds into a staggering $26,280 in pure wasted electrical costs. Furthermore, the excess heat generated by the 200W generic fixtures will accelerate LED lumen depreciation, forcing early replacement and expensive crane rental fees. The math is undeniable: precise optical engineering is the ultimate financial firewall.
Conclusion: Elevating Your Project with Precision Lighting
Mastering light distribution is the ultimate dividing line between amateur, high-risk installations and professional, compliance-ready infrastructure. Whether you are deciphering asymmetrical polar curves to eliminate blinding driver glare, or matching precise IES Type III and Type IV optics to conquer strict municipal property line regulations, optical precision is paramount. Never evaluate a lighting fixture by its raw lumen output alone; always demand to see its effective lumens mapped flawlessly across the target area. By prioritizing optical control, you guarantee superior visibility, eliminate regulatory risks, and secure a massive reduction in your long-term operational expenditure.
Ready to Stop Wasting Energy on Bad Optics?
Don’t let poor light distribution drain your project budget or cause compliance failures. Let our engineering team design the perfect optical footprint for your site.
Get Your Free Optical Analysis & Quote