
What a High Bay Lighting Calculation Actually Is
A 30-by-40-foot garage with 12-foot ceilings. A buyer holding a spec sheet for a 150-watt, 20,000-lumen high bay. One question: is this the right light? The forum verdict came back within hours, and it was blunt: put it back. Twelve feet sits below the mounting height where high bay optics do their job. At that height, those 20,000 lumens arrive as glare in your eyes instead of coverage on your floor. The replies pointed to a strip-light layout delivering roughly 72,000 lumens across the same space at a 60 foot-candle target (r/Lighting, 2025).
That episode is worth five minutes of your attention, because the fix was not arithmetic. The buyer could have run any high bay lighting calculator on the market and still bought the wrong fixture. What the calculation cannot do is check whether you are asking it about the right category of light. That check comes first, and it takes one number: the mounting height, measured from floor to where the fixture actually hangs.

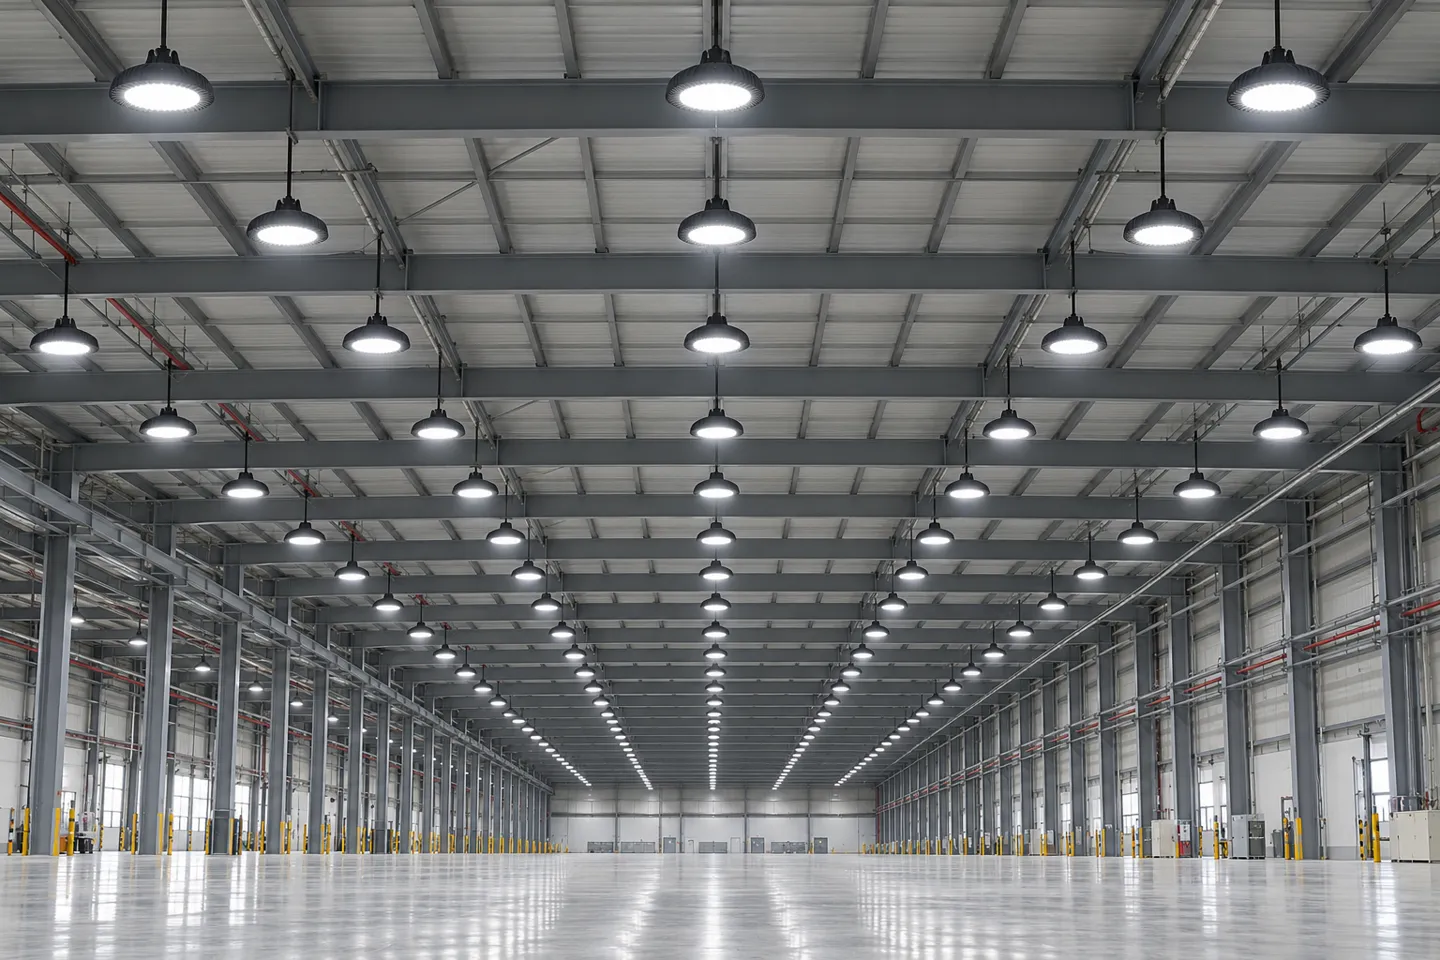
Below roughly 15 feet, you are in low bay or strip fixture territory, and most photometric guidance draws the high bay ceiling at 15 to 40 feet (LED Lighting Supply, n.d.). Some retailer calculators happily accept 12-foot inputs and will still print an answer (LED Light Expert, 2026). The tool runs either way. The physics does not. When the fixture hangs too low, its optics throw light past you and into your sightline, which is why the garage buyer above was advised to walk away.
One more input has changed the arithmetic for everyone: LED efficacy. Modern high bays deliver 130 to 150-plus lumens per watt against roughly 70 to 100 for the metal halide units they replace (LED Light Expert, 2026), which is why a count computed for a 400-watt HID hall shrinks dramatically when re-run in LED lumens. Calculate in lumens delivered to the floor, never in watts consumed, and the same method serves a 600-square-foot workshop and a 60,000-square-foot distribution center.
Before you run any numbers, run this check:
- Clearance to mount at or above 15 ft?
- Floor area beyond roughly 500 sq ft, or racking taller than 8 ft?
- Task needs uniform coverage across zones, not a single bright spot?
- Three yes answers: high bay territory, continue to the lumen method. Any no: look at low bay, strip, or wrap fixtures first.
The Lumen Method Step by Step, With Real Numbers
You have the fixture class right. Now the count, in five steps, each with numbers you can actually fill in.
Step 1 sets the target foot-candle level by task. The Illuminating Engineering Society publishes recommended levels per space type, and its warehousing values are more conservative than most retailer charts: 10 fc for bulky items with large labels, 30 fc for small items with small labels, 10 fc at receiving and shipping docks, and 30 fc at receiving and staging areas (Waypoint Lighting, IES recommended light levels, n.d.; the underlying criteria live in the IES Lighting Library). Retailer task tables run warmer, with 20 to 30 fc for rack picking and 30 to 50 fc for packing and inspection (LED Light Expert, 2026). When two charts disagree, take the IES value as the floor for the space type, and add margin only where the task genuinely demands it.
| Task area | IES recommended (range) | Practical design pick |
|---|---|---|
| Bulky items, large labels | 10 fc (5-20) | 10-15 fc |
| Small items, small labels | 30 fc (15-60) | 20-30 fc |
| Receiving / shipping dock | 10 fc (5-20) | 10-20 fc |
| Receiving / staging | 30 fc (15-60) | 20-30 fc |
| Detailed inspection or fine assembly | 50-100 fc | 50-100 fc |
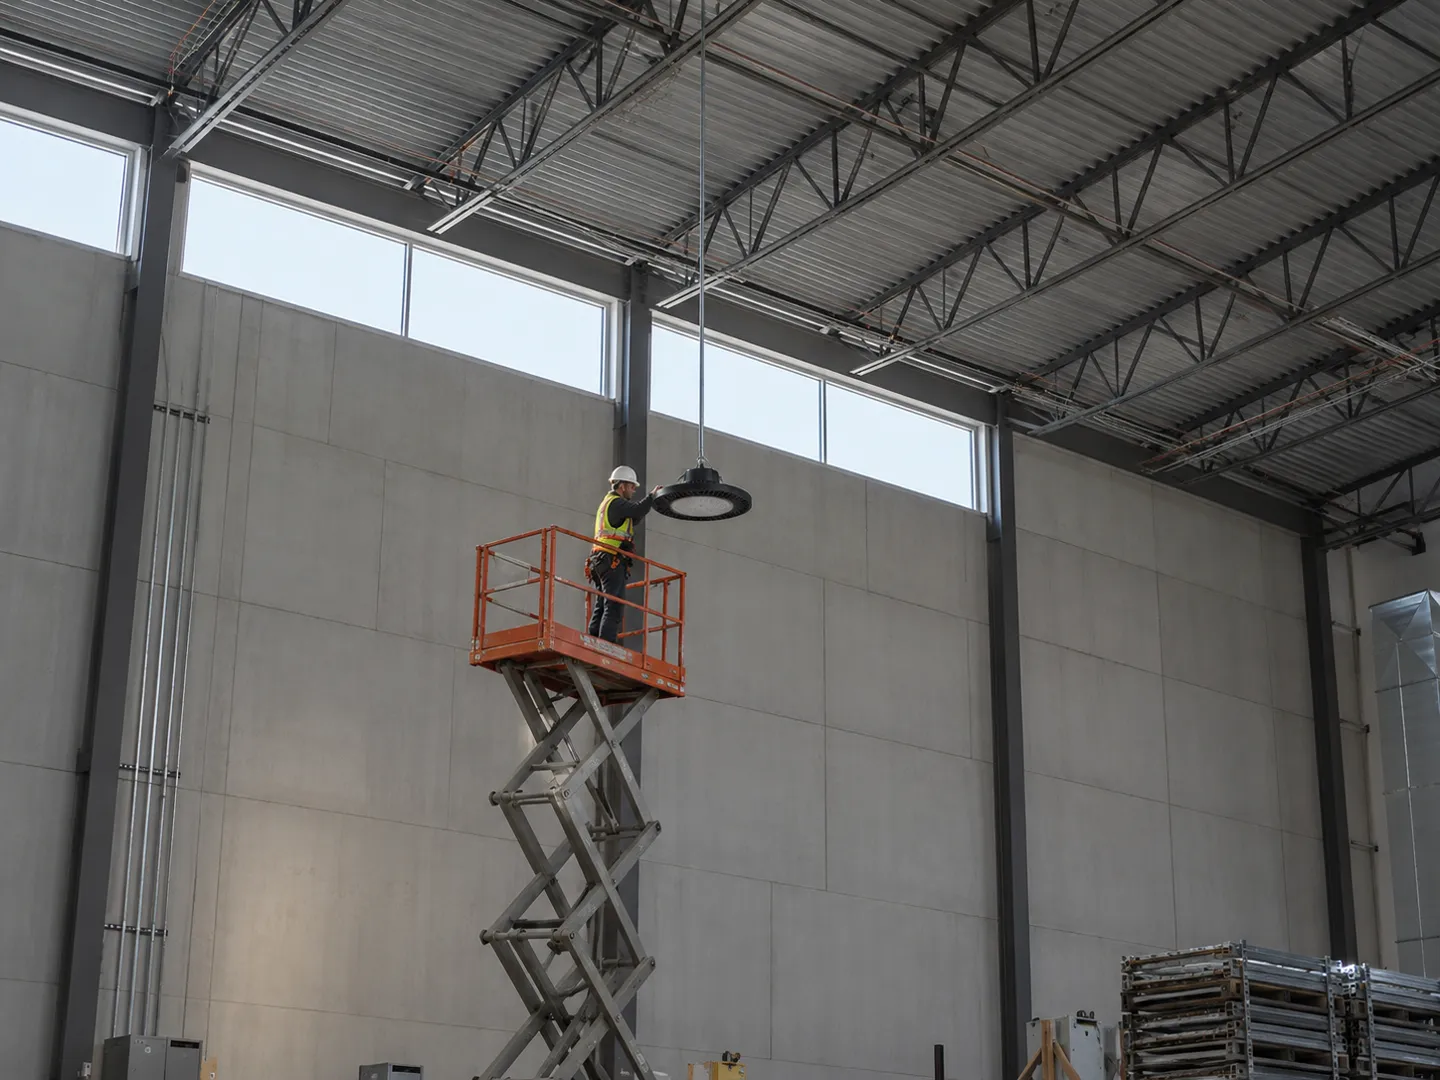
Step 2 measures the area and the true mounting height. Use the floor area in square feet and the height of the fixture, not the roof deck. Insulation, joists, and pendant length all eat into that number, and every downstream factor in this method keys off it.
Step 3 chooses CU and LLF before you trust any output. The lumen method reads: lumens needed = target fc × area ÷ (CU × LLF) (LED Light Expert, 2026). The coefficient of utilization (CU) captures how much of a fixture’s rated output actually reaches the work plane given room geometry and surface reflectance, and the light loss factor (LLF) derates for lumen depreciation and dirt over the fixture’s life. A common starting point is 0.9 for lumen depreciation times 0.9 for dirt, which lands near 0.8. CU for a typical warehouse cavity with reasonable reflectances commonly lands between 0.7 and 0.9. It drifts lower in tall, narrow, dark-surfaced rooms. Every fixture ships with a photometric file containing its CU tables, so these are numbers you can look up rather than guess.
Step 4 runs the count, then re-runs it with the derates. Take a 30,000 square foot general warehouse targeting 20 fc. Raw demand is 600,000 lumens. Divided by 22,000-lumen, 150-watt-class fixtures, that is 28 fixtures, which is exactly where a retailer’s rough check of 25 to 35 fixtures lands (LED Light Expert, 2026). Now apply CU 0.8 and LLF 0.8: delivered output is 64 percent of rated, and the same room needs roughly the low 40s. Same building, same fixture. The derates moved the count by half, which is why Step 3 is not optional bookkeeping.
Step 5 sanity-checks spacing and beam angle. Spacing rules of thumb tie layout to mounting height: about 15 to 18 feet between fixtures at a 20-foot mount, and 20 to 25 feet at 30 feet (LED Lighting Supply, n.d.). Output follows the same ladder: retailer tier charts map 12 to 20 foot ceilings to 100-150 W units in the 15,000-22,000 lumen class, and 20 to 30 foot ceilings to 150-240 W units around 24,000-36,000 lumens with narrower optics (LED Light Expert, 2026). Beam angle follows the same logic: 60 to 90 degree optics concentrate output for tall, aisle-heavy racks, while 120 degree spread suits lower, open floors (LED Light Expert, 2026). If your Step 4 count implies spacing far beyond these bands, the fix is usually a higher-output fixture with narrower optics, not more of the same unit.
Write down the CU and LLF you used before you request quotes. When suppliers respond, ask them to state theirs. Two quotes computed on different assumptions are not comparable prices.
- 1Set the target foot-candle level
- 2Measure area and true mounting height
- 3Choose CU and LLF
- 4Run the count with derates
- 5Check spacing and beam angle
Where Simple Calculations Break Down
So far the method behaves. But the lumen method computes an average for an empty, rectangular, evenly dirty room, and almost no real facility is that room. Four things break the average, and each one fails in a direction you can predict.
When the Height Is Wrong: The Fixture-Class Trap
The garage case at the top of this article is the cleanest example: a valid-looking wattage and lumen count wrapped around the wrong fixture class. The failure is quiet because nothing in the arithmetic flags it. A calculator will return 150-watt fixture counts for a 12-foot room all day. The adjudication between conflicting guidance is simple. Guidance drawing the high bay floor at 15 feet (LED Lighting Supply, n.d.) and installers who called 12 feet out as “not really high enough, 15 to 20 feet minimum” (r/Lighting, 2025) agree with each other. The calculators accepting 12-foot inputs are the outlier. Take the conservative line, measure floor to fixture, and below 15 feet, price strip, wrap, or low bay products instead.
Racks and Obstructions: Why the Average Lies
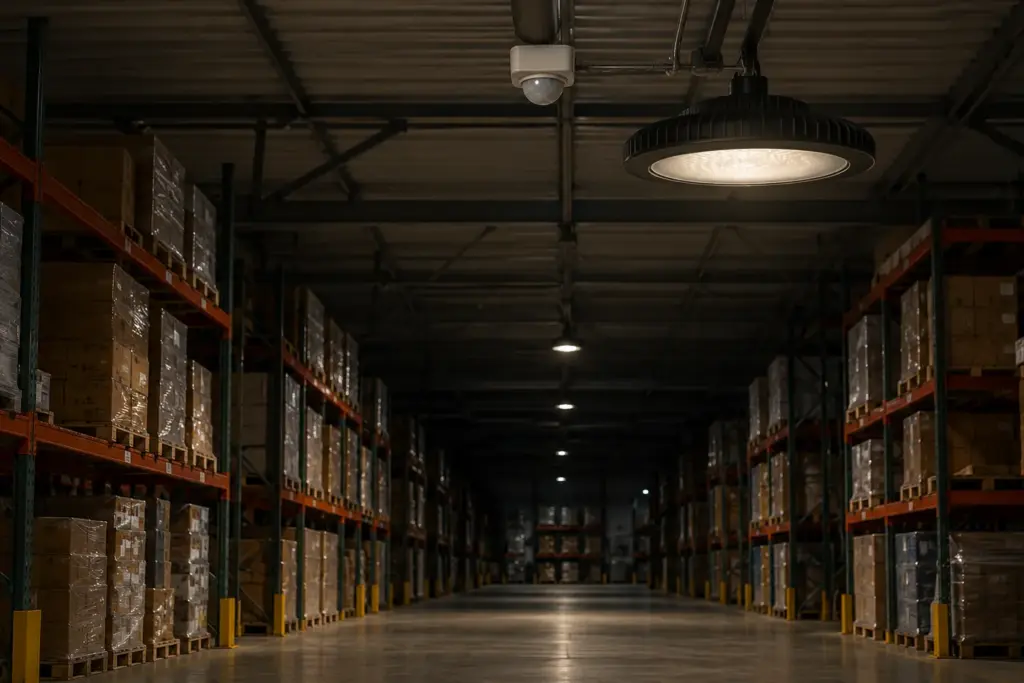
The lumen method assumes light travels unobstructed from fixture to floor. Put 20-foot-tall racking in that room and the assumption dies. Aisle floors sit in shadow relative to the open zones, the room cavity ratio climbs, and CU drops with it. The room average can still read on target while picking aisles fall well below it. This is the first root of the most expensive failure in industrial lighting: the count is right and the layout is wrong. The practical check costs nothing: mark your rack runs and dock zones on the floor plan before anyone quotes, and treat rack-top surfaces as the work plane for aisle calculations, not the floor.

Uniformity: The Number No Calculator Prints
Uniformity, usually written as average-to-minimum illuminance, is what keeps the middle aisles from going dim while the open floor reads fine. Industry guidance treats ratios in the 3:1 to 4:1 range as the working ceiling for acceptable industrial spaces (LED Lighting Supply, n.d.). A layout that over-spaces fixtures to squeeze the fixture count down will pass any arithmetic check and still fail this one. And the failure surfaces late: uniformity problems are discovered after the fixtures are on the ceiling, when moving one means renting a lift.
CU and LLF: Two Numbers People Guess Wrong
Both factors bias in one direction. Set LLF to 1.0 and you are budgeting against a brand-new, factory-clean fixture that will never exist again after month one; the room dims from the day it opens. Set CU optimistically and every tall rack bank pushes it further down. The two errors compound: an optimistic CU at 1.0 LLF can overstate delivered light by a third or more against the same room computed at 0.8 and 0.8. The remedy is documentation, not optimism. Publish your assumptions in the RFQ, require bidders to compute on stated values, and the numbers become comparable again.
The matrix below condenses all four failures into one reference:
| Method | Best for | Where it breaks | Next move |
|---|---|---|---|
| Rule-of-thumb charts | Quick budgeting, small open spaces | Any nonstandard height, racking, or task zoning | Treat as a budget range only |
| Lumen method | Counts for open floors up to mid-size facilities | Racks, tall obstructions, task zoning, guessed CU/LLF | Add derates honestly, then verify layout |
| Photometric simulation | Aisles, docks, any rack-heavy or zoned floor | Overkill cost below roughly 500 sq ft of simple space | Commission a layout before purchase |
| Supplier layout package | Turning a count into an installable plan | Trust without checking the inputs | Cross-check spacing and uniformity yourself |
From Fixture Count to Photometric-Grade Package
At small scale the risks above are annoyances. At project scale they are budget lines, which is why the work changes character once a count becomes a purchase order. Three steps take you from “the calculator said 41” to a package you can hold a supplier against.
Step 1: Cross-Check the Count Before You Trust It
Run two checks that take minutes. First, divide the proposed spacing by the mounting height. If the implied ratio wanders far from the 15-to-18-feet-at-20-feet band, the layout, not the count, is the problem (LED Lighting Supply, n.d.). Second, reverse the arithmetic: multiply fixture lumens by count, apply your CU and LLF, and divide by area. If the delivered fc misses your target by more than about 10 percent, someone’s assumptions differ, and you want to know whose before the PO goes out.
Step 2: Demand the Photometric Report, Not Just the Count
A serious layout comes back with three numbers per zone: minimum, average, and maximum illuminance, plus the average-to-minimum ratio. Minimum tells you where the dark corners are, maximum tells you where fixtures overlap and glare builds, and the ratio is the uniformity verdict against that 3:1 to 4:1 working ceiling. This is the step web calculators structurally cannot do. Vendors say the same when they warn that calculators “provide rough fixture counts but lack photometric accuracy, spacing guidance, or uniformity analysis” (LED Lighting Supply, n.d.). Software-grade simulation models each rack and dock; a widget multiplies three numbers. Ask which one you are getting.
Step 3: Put the Deliverables Into the RFQ
The report only protects you if the requirement to produce it is written down before pricing. The batch risks are real. Electricians installing high bays in bulk report units arriving with defective threads, fixtures that had to be returned mid-job, on projects running hundreds of units (r/electricians, 2025). An RFQ without deliverables gives you no lever when a batch underperforms. The table below is the minimum package to demand:
| Deliverable | What it is | What it protects you from |
|---|---|---|
| Layout / photometric plan | Fixture positions, aim, and zone-by-zone light levels | Dark aisles and glare discovered after install |
| IES or LDT photometric files | The manufacturer’s measured light distribution data | Counts computed on invented optics |
| Uniformity report | Min / avg / max and avg:min per zone | Over-spaced layouts that pass arithmetic checks |
| Certification set | UL or ETL for North America, CE for EU, DLC listing where rebates apply | Shipments stuck at customs, rebates refused |
| Warranty terms in writing | Coverage period and claim process per product line | Silent downgrades to short coverage on engineered lines |
Photometric support is also a supplier filter in its own right. A manufacturer that runs lighting simulations from your project’s photometric data, publishes its IES files, and holds certifications on request rather than on promise plays in a different league. The alternative is a vendor quoting lumens per dollar off a spreadsheet. Our high bay line at WOSEN was packaged around exactly this logic. The optics run from 15 to 120 degrees so beam angle can match rack geometry. Photometric simulation runs per project before quoting, not after. And UL, ETL, SAA, ENEC, or TUV certification is available on request rather than baked into a single market’s spec (see the LED high bay range). Delivered work holds the same standard: an industrial high bay installation for a mining operation in the DRC was engineered around site constraints rather than a catalog default. The line to draw in your RFQ is the same regardless of who wins the bid: file types, uniformity targets, and certification scope are deliverables, not favors.
One boundary keeps this proportionate. Below roughly 500 square feet of simple, open space, commissioning a simulation costs more than the risk it retires. The lumen method plus the spacing check in Step 1 is a complete answer for a small workshop. Racks, docks, or anything past a few thousand square feet flips the economics the other way.
What This Means for Your Next Lighting Bid
Read the whole ladder back from the bid desk and the commercial logic is short. The count is cheap to get and everyone gets it, so it prices like a commodity. The layout is where projects actually fail, and it fails after installation, at height, on the contractor’s dime. That is why a bid missing the photometric package is not a cheaper equivalent. It is a quote that has quietly moved the verification cost onto you. You pay it at lift-rental rates if the uniformity comes back wrong.
So run the tiers the way they are built. Rule-of-thumb charts handle budgeting. The lumen method with honest derates handles procurement shortlists. Photometric layouts gate any purchase order on a racked or zoned floor. Then make the gate contractual. Suppliers who can deliver layout files, IES data, and uniformity reports will state them in writing within a day. Those who cannot will change the subject to price per unit. Both responses are information.
Treat the deliverable list as the qualification test, not a courtesy request. The calculator then becomes what it should have been all along: the first screen in a procurement process, not the last. When you are comparing manufacturers on that basis, WOSEN’s high bay series pages list a 5-year warranty, with a 12-hour response commitment on overseas inquiries. We will run your room’s photometrics before you commit to a fixture count.
References
- Waypoint Lighting. “IES Recommended Light Levels.” Compiled by CleaResult Consulting from the Illuminating Engineering Society Lighting Handbook. n.d.https://waypointlighting.com/uploads/2/6/8/4/26847904/ies_recommended_light_levels.pdf
- Illuminating Engineering Society. “The IES Lighting Library Standards Collection.” n.d.https://ies.org/standards/lighting-library/
- Reddit r/Lighting. “Help Picking the Right LED High Bay Size.” 2025.https://www.reddit.com/r/Lighting/comments/1jkq764/help_picking_the_right_led_high_bay_size/
- Reddit r/electricians. “Bidding High Bay Lights?” 2025.https://www.reddit.com/r/electricians/comments/1immgul/bidding_high_bay_lights/


 English
 Spanish
 French
 German
 Italian
 Arabic
 Russian
 Portuguese
 Dutch
 Indonesian
 Turkish
 Polish