
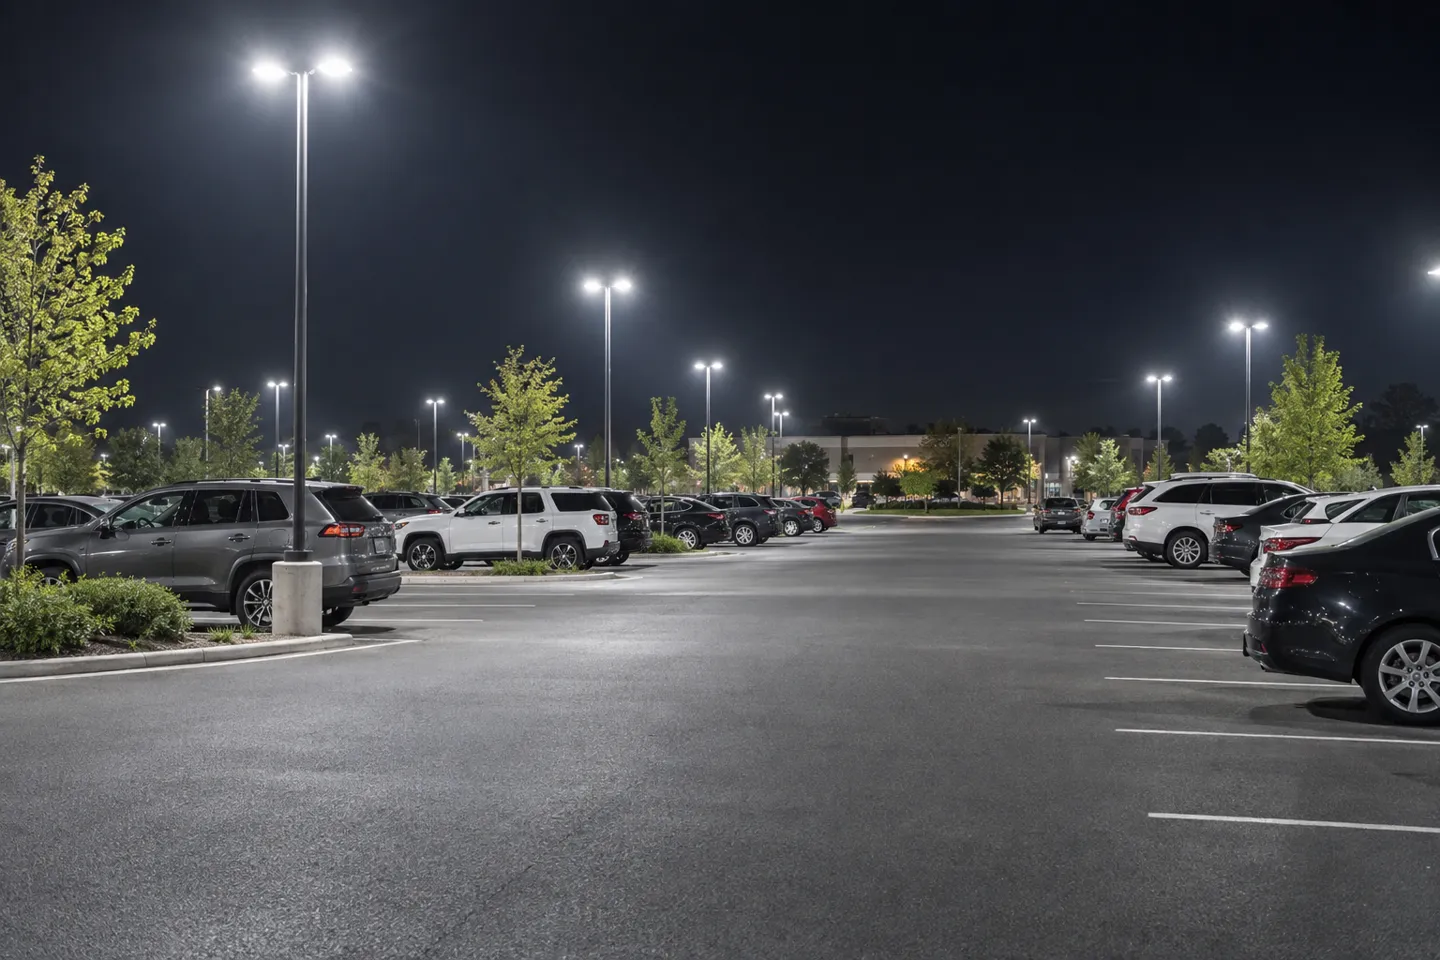
If you have ever walked a parking garage that passed its photometric report yet still shows a black corner between two poles, you already understand the problem. The lighting uniformity ratio deserves more attention than it usually gets.
Average illuminance is what you bought. Uniformity is whether it landed where people actually are.
What a Lighting Uniformity Ratio Actually Measures
A lighting uniformity ratio describes how evenly illuminance spreads across a surface. Take the darkest measured point on the ground. Compare it to the average (or to the brightest point). The result is the number that spec sheets, tender documents, and acceptance reports all quote.
The trouble starts with the fact that “the number” is not one number. The industry runs on three conventions, and they are not interchangeable:
- U0 (min ÷ average). The European convention, used in EN 13201. A U0 of 0.40 means the darkest point receives at least 40% of the average illuminance.
- Min-to-max ratio (Emin ÷ Emax). Some references label this U1 or U2, and the labels conflict between sources. The ratio itself is what matters.
- Max-to-min expressed as a ratio (Emax:Emin), such as 4:1 or 15:1. Common in North American practice and in security guidelines. A 4:1 max-to-min ratio equals a min-to-max of 0.25.
This is why you can find one document demanding “uniformity no worse than 4:1” for parking facilities (TSA/airport security guidelines). Meanwhile, an IES-based design guide for the same application works with a 15:1 max-to-min criterion (AGi32 education reference to IES RP-8-18). Neither number is wrong. They come from different sources, different editions, and sometimes different ratio bases. Comparing them directly is the fastest way to fail a review.
A worked example makes the mechanics concrete. Picture a 3×3 grid of illuminance readings on the ground, in lux:
Worked Example: Nine Grid Points
| Reading Point | Illuminance (lux) |
|---|---|
| P1 | 45 |
| P2 | 62 |
| P3 | 58 |
| P4 | 50 |
| P5 | 68 |
| P6 | 55 |
| P7 | 42 |
| P8 | 60 |
| P9 | 52 |
The minimum is 42 lx, the maximum is 68 lx, and the average is 492 ÷ 9 = 54.7 lx. So U0 = 42 ÷ 54.7 = 0.77, the min-to-max ratio = 42 ÷ 68 = 0.62, and expressed American-style that is a 1.62:1 max-to-min ratio. Same nine measurements, three valid ways to report them.
Why does anyone care this much? Three practical reasons. Dark patches hide trip hazards and, in security applications, people. The eye strains as it adapts between bright and dark zones, which reads as discomfort and glare complaints. Uniformity is also a contractual line item, so a miss is a failed acceptance with real rework costs. (And if you arrived here from the textile industry, where “uniformity” means something else entirely, that is a different subject.)
U0 (European)
U0 = Emin ÷ Eav
e.g. 0.40 on M-class roads
Min-to-Max
Emin ÷ Emax
e.g. 0.62
Max-to-Min (American)
Emax:Emin
e.g. 1.62:1 — divide 1 by the decimal form
Uniformity Requirements by Application
The value you must hit depends on what the surface is used for, and every major application has a published target. The table below collects the commonly cited requirements, with the ratio basis stated for each row, because that basis is where most comparison errors happen.
Commonly Cited Uniformity Targets by Application
| Application | Typical Requirement | Ratio Basis | Source Family |
|---|---|---|---|
| Motorway / main roads (M classes) | U0 ≥ 0.40 (0.35 for lower M classes) | min ÷ average (luminance) | EN 13201 |
| Parking lots (open) | max:min ≤ 15:1 per RP-8-18 Ch.17, often quoted as avg:min 4:1 | max-to-min | IES RP-8 / security guidelines |
| Parking structures | around 6:1 max-to-min | max-to-min | IES-based guidance |
| Warehouse / high-bay general areas | U0 ≈ 0.4–0.6 with spacing-to-height ratio ≈ 1.0–1.5 | min ÷ average | IES practice guides |
| Baseball infield / outfield | 1.2:1 / 1.7:1 max-to-min | max-to-min | IES sports recommendations |
| Office and indoor general | U0 ≥ 0.40–0.60 depending on task | min ÷ average | EN 12464 family |
(European Commission LED street lighting procurement guidelines, 2017; Bouroussis et al., Energies, 2022; AGi32/RP-8-18; Stouch Lighting sports guide, 2024)
Why do published numbers for the same application still disagree? Three reasons, in order of how often they bite. Standards get revised, so a 2017 guideline and a 2025 blog post may quote different editions of the same IES recommendation. Regions use different families: the EN system writes decimal min-to-average values while North American practice writes max-to-min ratios. A “0.4” and a “4:1” can describe remarkably different performance. And ratio bases get swapped silently, which is how a 15:1 max-to-min criterion and a 4:1 average-to-minimum criterion end up in two documents about the same parking lot.
Convert before you compare: a max-to-min ratio of X:1 equals a min-to-max of 1/X. A decimal U0 of 0.4 is stricter than a 4:1 max-to-min on most surfaces, because the average sits below the maximum.
Conversion quick reference
Two footnotes to keep the map complete. Diffuse indoor sources such as LED panels achieve high uniformity almost by construction, so indoor is rarely where uniformity battles are fought. And pedestrian-scale schemes sometimes add semicylindrical illuminance uniformity (for face recognition rather than ground coverage), a special clause you will meet in tender documents, not in this article.
One caution has saved tenders: confirm which standard edition and which measurement basis the authority or client specification invokes. Do this before you fill any table like the one above into a bid. European EN values and North American IES values cannot be mixed into one submission.
Before a uniformity number goes into your bid, get the photometric calculation that stands behind it.
Request a pre-bid photometric checkFixing Uniformity at the Layout Stage
When a calculation returns a failing uniformity number, the tempting move is to swap in a brighter fixture. That is usually the most expensive and least effective move. In a working layout, the geometry, not the lumen package, is what shapes the uniformity ratio. Three levers, in the order you should pull them.
Spacing-to-Mounting-Height Ratio (S/MH)
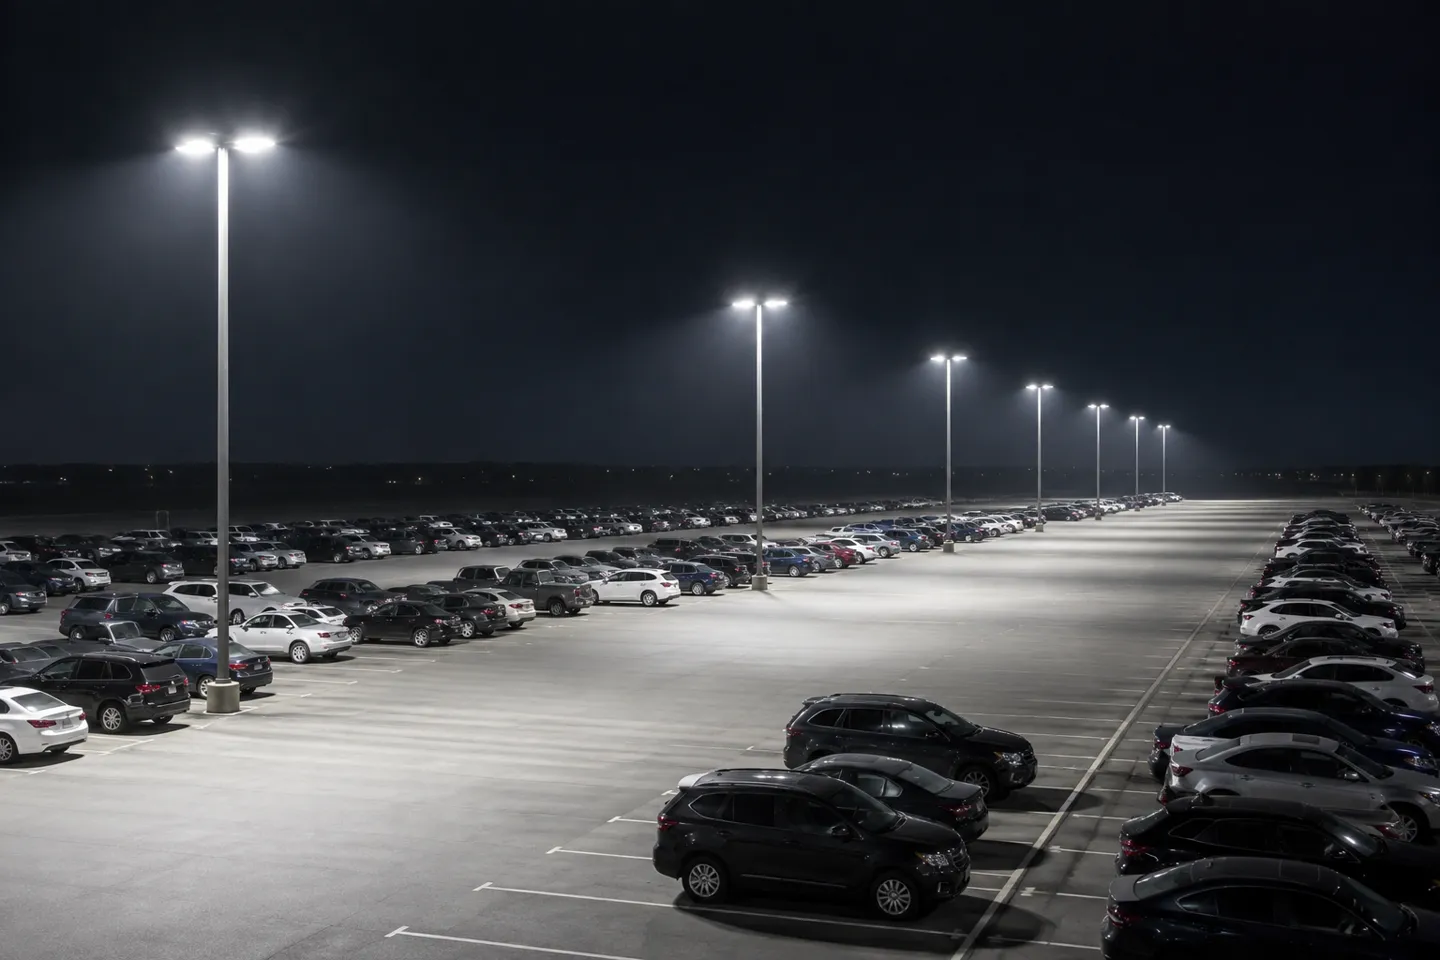
The overlap between adjacent beams is what smooths the floor. Push fixtures too far apart and dark valleys open between poles; cluster them and hotspots form directly under each one. Warehouse practice puts general-area spacing at roughly 1.0 to 1.5 times mounting height (Hyperlite warehouse uniformity guide, 2025). Linear high bays with wide ~110° optics run tighter, around 0.6 to 0.9 of mounting height (Hyperlite spacing guide, 2025). As a feel for magnitude: halving an oversized spacing ratio typically moves a marginal U0 from the failing 0.3s toward the 0.4 line. Adding lumens barely moves it at all. That is why “just add fixtures” often degrades uniformity first and rescues illuminance second. Each extra pole creates a new bright core and a new valley next to it.
Aiming and Pole Position
On roads, arm length, tilt, and luminaire placement across the carriageway decide where the beam’s long axis lands. A few degrees of excess tilt shifts the hotspot out of the lane and into oncoming drivers’ eyes. In area and sports lighting, the working rule is multi-directional coverage: key points lit from two or three directions so shadows and valleys cancel instead of stacking. Sports designs take this furthest. They aim narrow beams at overlapping targets under strict maximum aiming angles, precisely because uniformity, not raw level, is the pass criterion (Stouch Lighting, 2024).
Surfaces and Surroundings
The same layout reports different uniformity on different surfaces, because pavement reflectance feeds the interreflected component that fills valleys. A worn bright concrete lot and fresh dark asphalt under identical fixtures can differ measurably in U0. Indoors, low ceiling and wall reflectance produce the same effect. A tall rack next to a bright aisle manufactures a “dark zone” that the calculation grid will happily confirm. Check surface reflectance assumptions before you reposition a single fixture. Sometimes the room, not the layout, is the problem.
The boundary you cannot negotiate with geometry: in retrofit projects where pole positions and mounting heights are locked, layout changes may be impossible. A target U0 can be simply unreachable with any lens you bolt onto the existing poles. Before promising a uniformity number on a retrofit, confirm the existing pole height, setback, and spacing. If those are fixed and hostile to the target, say so in the proposal rather than absorbing the acceptance risk.
Retrofit rule: confirm existing pole height, arm, and spacing first. If the geometry is locked against the target, no fixture swap will conjure the missing uniformity.
Fixture Optics: The Ceiling of Achievable Uniformity
Layout determines how well you approach the target. Optics determines where the ceiling sits. Two floodlights with identical lumen output can land one project at U0 = 0.3 and another at 0.6. The difference is written in their photometric files before either is installed.
A narrow-beam optic concentrates intensity at the center and leaves the periphery dark. A wide optic spreads the same lumens into overlap that reads as uniformity. When two same-lumen fixtures with different beam angles produce wildly different uniformity on the same site, the explanation is the distribution. No amount of recalculating will change that.
The ceiling rule
The beam sets the ceiling. The lumens only set the level.
Same lumen package, same site — the distribution alone doubles the uniformity number.
How Beam Angle and Light Distribution Set the Ceiling
Every degree family of optics has a natural habitat. Narrow beams (15°–45°) suit high masts and sports towers where light must travel and land precisely. Medium beams (60°–90°) fit area lighting and parking lots where overlap between poles does the smoothing. Wide beams (90°–120°) belong under ceilings and in flood applications where fixtures sit close to the task. Asymmetrical distributions (type II/III road optics, aisle optics) shift light sideways to follow a carriageway or a rack aisle instead of dumping it at the pole base. Pick the wrong family and the layout fight from the previous section becomes unwinnable. You are asking spacing to fix what the lens has already decided.

Reading an IES or LDT File Before You Trust a Number
Manufacturers publish photometric data as IES (North American format) or LDT/EULUMDAT (European format) files, and these files contain everything a uniformity prediction needs. Open one and check four things. The luminous intensity distribution (the polar plot) shows whether the beam is the shape your layout needs. Peak intensity relative to total lumens reveals how spiky the beam is; a high peak-to-lumen ratio forecasts hotspots. The stated beam angle tells you which degree family you are buying. And the zonal lumen summary shows where the light actually goes, degree band by degree band. Any supplier unwilling to provide a full photometric file for the exact SKU you are buying is asking you to accept a uniformity commitment blindfolded.
Matching Optics to Application: The Selection Matrix
Optics Selection Matrix by Application
| Application | Recommended Beam Family | Compliance Notes | When to Change Approach |
|---|---|---|---|
| Streets and roadways | asymmetrical type II/III, 60°–90° effective width | U0 on carriageway per EN 13201 class; longitudinal uniformity (UI) also applies | switch to wider distribution or add poles when UI fails on curves |
| Parking lots and area | medium-wide 90°–120° with multi-pole overlap | avg:min and max:min both specified in IES practice; verify at property line for light trespass | use asymmetrical site optics when poles sit at lot edges |
| Warehouse high-bay | 60°–90° for high aisles, 90°+ for open areas | U0 ≈ 0.4–0.6 with S/MH 1.0–1.5 | aisle optics when racks dominate |
| Sports fields | narrow 15°–45° with aiming design | class-dependent max:min (e.g. 1.2:1 infield); aiming angles restricted | never substitute general floodlights; add towers or raise class optics when broadcast requirements apply |
| Billboard / façade flood | narrow-medium 30°–60° | uniformity across the lit plane; avoid hotspot at center | split optics or increase setback when the center over-brightens |
Lens tolerance is the quiet variable here. The photometric file describes the design; the molded lens in production approximates it. Reputable manufacturers hold optical tolerances tight enough that mass-produced units track the published file. That is exactly why sample-based photometric verification exists, and why it belongs in your acceptance plan, covered next.
Acceptance Testing and Lifetime Uniformity
A design can clear the software calculation and still fail the field measurement. The gap between “calculated compliant” and “measured compliant” has three recurring sources, and every one of them is cheaper to handle in the contract than in the dispute.
First, the measurement grid. Uniformity is computed from points, so where the points sit and how densely they are spaced changes the result. A sparse grid can miss the darkest corner entirely; an unlucky grid line can manufacture a failure. This is why specifying engineers on professional forums insist on real, reviewable photometric calculations rather than one-line claims. Your acceptance documents should fix the grid protocol (spacing, plane, points per zone) before anyone unpacks a lux meter, consistent with the EN 13201 grid conventions (BEGA EN 13201 reference).

Second, the maintenance assumption. Every serious specification is written in maintained values: the illuminance promised after losses, not on day one. The light loss factor bundles lamp lumen depreciation, luminaire dirt depreciation, and other deprecations into a multiplier (IES LLF definition). LED practice commonly caps the lumen-depreciation component at 0.70 or better when light quantity matters (Royer, LEUKOS, 2014). If your tender says “U0 ≥ 0.4 maintained over 5 years” and the supplier calculated against initial values, you have approved two different projects. State the LLF assumption and the maintenance interval in the same sentence as the uniformity target.
Third, sample-to-production consistency. The certified sample and container-load serial production are not automatically the same optic. Lens tolerances, driver batch variation, and assembly drift all pull field uniformity away from the tested sample. The practical defense is a batch-level consistency check. Measure a defined sample from each production lot against the approved photometric file, not just the golden sample from two years ago.
Uniformity acceptance checklist
- Grid protocol (spacing, plane, points) written into the contract
- Maintained-value basis and LLF assumption stated with the target
- Instrument class and calibration date specified
- Re-measurement clause for disputed points
- Batch consistency sampling against the approved photometric file
Run that list before contract signature and most uniformity disputes never happen, because both parties measured the same project with the same rulers.
What This Means When You Choose a Lighting Supplier
Everything above collapses into one procurement insight: uniformity is a system outcome that the supplier’s optical capability gates. Layout decides how close you get to the ceiling. The ceiling itself is set by the beam shape in the photometric file. So a supplier’s ability to provide the right distribution, and to prove it in simulation, is the real variable you are buying.
For brand owners and project buyers this matters twice. If you private-label fixtures, your downstream customer’s uniformity clause becomes your warranty exposure. If you buy for tenders, the acceptance test in the section above is executed against your name. Either way, a vendor who can only quote lumens per watt has handed you a system-level commitment backed by a single-point parameter.
So evaluate optical capability before the purchase order, not after the photometric report arrives. Our own practice is built around exactly this. WOSEN offers beam angle and optical customization options across 15° to 120°, with matching IP65–IP67 and IK06–IK10 ratings. We run photometric simulations and issue customized test reports, so the uniformity numbers are verified against your actual geometry before the tooling starts. Ask every bidder for the same four things. First, the beam-angle and distribution options they can actually manufacture. Second, complete IES/LDT files for the exact SKU. Third, willingness to run and share photometric calculations for your layout. Fourth, a sample-to-production consistency method. A supplier who clears those four will rarely need the acceptance checklist to save you. One who resists them has answered your question already.
The honest boundary: if you buy standard catalog fixtures for commodity resale with no specification market attached, this capability screen carries less weight. Price and lead time can lead your decision. Uniformity capability earns its place on the checklist the moment a written number appears in your contract.
Prove the uniformity number before tooling starts
Send your pole layout and target U0: WOSEN runs the photometric simulation on your actual geometry and issues the test report. Beam-angle options 15°–120°, IP65–IP67.
Start a uniformity reviewEvery criterion in this article is checkable before a single fixture is wired: beam-angle options, complete photometric files, simulation support, and batch consistency method. The full range and optical customization options referenced above are available at wosenled.com.
References
- European Commission. “LED Street Lighting Procurement & Design Guidelines.” 2017. https://ec.europa.eu/research/participants/documents/downloadPublic?documentIds=080166e5b6d1cf07&appId=PPGMS
- Bouroussis, C.A. et al. “Simulations and Analysis of the Optimum Uniformity for Road Lighting.” Energies (MDPI). 2022. https://www.mdpi.com/1996-1073/15/9/2983
- AGi32 Education. “Establish Design Criteria” (IES RP-8-18, Chapter 17: Parking Lots). https://education.agi32.com/SiteLighting/Content/Site%20Lighting/Establish%20Design%20Criteria.htm
- Stouch Lighting. “The Importance of Light Uniformity in Sports Field Lighting Systems.” 2024. https://www.stouchlighting.com/blog/the-importance-of-light-uniformity-in-sports-field-lighting-systems
- Hyperlite. “Achieving Lighting Uniformity in a Warehouse Layout.” 2025. https://hi-hyperlite.com/blogs/comprehensive-guides/warehouse-lighting-uniformity-layout-guide
- Hyperlite. “Linear High Bay Spacing & Layout Guide.” 2025. https://hi-hyperlite.com/blogs/comprehensive-guides/linear-high-bay-spacing-layout-guide
- Illuminating Engineering Society. “Light Loss Factor (LLF).” https://ies.org/definitions/light-loss-factor-llf
- Royer, M. “Lumen Maintenance and Light Loss Factors: Consequences of Current Design Practices for LEDs.” LEUKOS. 2014. https://www.tandfonline.com/doi/full/10.1080/15502724.2013.855613
- BEGA. “Maintained Illumination According to DIN EN 13201.” https://www.bega.com/en/knowledge/lighting-theory/reference-values-for-illumination/maintained-illuminance-according-to-dinen13201
- TSA/Airport security guidelines (parking facility uniformity 4:1). https://www.sskies.org/images/uploads/subpage/PARAS_0004.Recommended_Security_Guidelines.FinalReport.v2.pdf
- WOSEN. “One-Stop Custom LED Lighting Solutions.” https://www.wosenled.com/customization/
- WOSEN. Homepage. https://www.wosenled.com/

 English
  Spanish
  French
  German
  Italian
  Arabic
  Russian
  Portuguese
  Dutch
Dutch  Indonesian
  Turkish
  Polish